
The Decline Of US Housing Affordability

The cost of a typical American home has raced far ahead of paychecks.
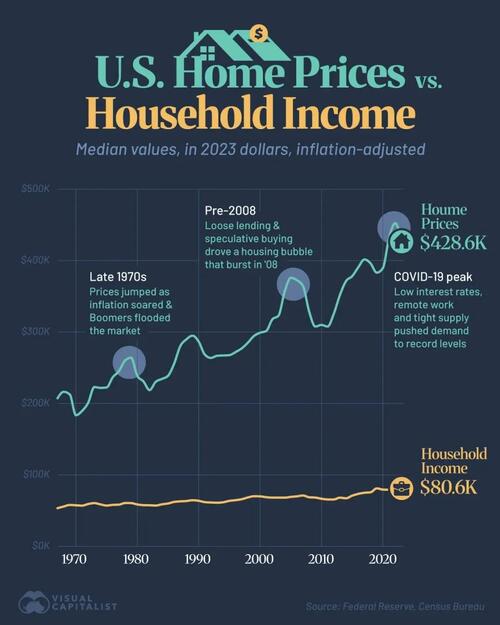
This graphic (and below video), via Visual Capitalist’s Pallavi Rao, charts how the median sales price of a newly-built privately-owned residential units (including houses and apartments) and the median household income have moved since 1967.
Data for this graphic is sourced from the Census Bureau (both home prices and household incomes).
The Federal Reserve’s CPI-U index was used to convert both to 2023 dollars for an apples-to-apples comparison.
Tracking U.S. Home Prices vs. Household Incomes
The median sales price of a new U.S. home reached $428,600 in 2023. That price was more than five times the median household income of $80,610 that year.
See how both metrics have moved since 1967 in the video below.
The widening gap underscores why today’s buyers feel squeezed, even with low-down-payment loans and longer mortgage terms.
It also hints at deeper forces, from land-use rules to interest-rate cycles, shaping the housing market’s boom-and-bust rhythm.
The Affordability Ratio Has Doubled Since 1970
Dividing price by income yields a home-price ratio, a quick gauge of affordability. A ratio of 3 is often cited as a sustainable benchmark.
Back in 1970, the typical new home cost just 3.2 times the median income.
| Year | Median Household Income (2023 Dollars) |
Median Home Prices (2023 Dollars) |
Home-Price Ratio |
|---|---|---|---|
| 1967 | $53,530 | $207,346 | 3.87 |
| 1968 | $55,810 | $216,372 | 3.88 |
| 1969 | $58,010 | $212,640 | 3.67 |
| 1970 | $57,580 | $183,645 | 3.19 |
| 1971 | $57,090 | $189,631 | 3.32 |
| 1972 | $59,330 | $201,110 | 3.39 |
| 1973 | $60,610 | $223,036 | 3.68 |
| 1974 | $58,780 | $221,845 | 3.77 |
| 1975 | $57,180 | $222,510 | 3.89 |
| 1976 | $58,160 | $236,658 | 4.07 |
| 1977 | $58,450 | $245,337 | 4.20 |
| 1978 | $60,720 | $260,172 | 4.28 |
| 1979 | $60,610 | $264,082 | 4.36 |
| 1980 | $58,720 | $238,856 | 4.07 |
| 1981 | $57,730 | $230,893 | 4.00 |
| 1982 | $57,570 | $218,817 | 3.80 |
| 1983 | $57,210 | $230,362 | 4.03 |
| 1984 | $58,930 | $234,356 | 3.98 |
| 1985 | $60,050 | $238,795 | 3.98 |
| 1986 | $62,280 | $255,752 | 4.11 |
| 1987 | $63,060 | $280,232 | 4.44 |
| 1988 | $63,530 | $289,865 | 4.56 |
| 1989 | $64,610 | $294,952 | 4.57 |
| 1990 | $63,830 | $286,609 | 4.49 |
| 1991 | $61,960 | $268,476 | 4.33 |
| 1992 | $61,450 | $263,841 | 4.29 |
| 1993 | $61,150 | $266,823 | 4.36 |
| 1994 | $61,800 | $267,237 | 4.32 |
| 1995 | $63,770 | $267,743 | 4.20 |
| 1996 | $64,710 | $271,968 | 4.20 |
| 1997 | $66,050 | $277,145 | 4.20 |
| 1998 | $68,470 | $285,059 | 4.16 |
| 1999 | $70,210 | $294,504 | 4.19 |
| 2000 | $70,020 | $299,039 | 4.27 |
| 2001 | $68,870 | $301,489 | 4.38 |
| 2002 | $68,310 | $317,787 | 4.65 |
| 2003 | $68,350 | $322,991 | 4.73 |
| 2004 | $68,250 | $356,511 | 5.22 |
| 2005 | $69,310 | $375,861 | 5.42 |
| 2006 | $70,080 | $372,580 | 5.32 |
| 2007 | $71,210 | $364,303 | 5.12 |
| 2008 | $68,780 | $328,474 | 4.78 |
| 2009 | $68,340 | $307,774 | 4.50 |
| 2010 | $66,730 | $309,934 | 4.64 |
| 2011 | $65,750 | $307,764 | 4.68 |
| 2012 | $65,740 | $325,413 | 4.95 |
| 2013 | $68,220 | $351,714 | 5.16 |
| 2014 | $67,360 | $371,326 | 5.51 |
| 2015 | $71,000 | $378,214 | 5.33 |
| 2016 | $73,520 | $390,768 | 5.32 |
| 2017 | $75,100 | $401,637 | 5.35 |
| 2018 | $75,790 | $396,065 | 5.23 |
| 2019 | $81,210 | $383,175 | 4.72 |
| 2020 | $79,560 | $389,573 | 4.90 |
| 2021 | $79,260 | $431,240 | 5.44 |
| 2022 | $77,540 | $452,385 | 5.83 |
| 2023 | $80,610 | $428,600 | 5.32 |
By 2004, that ratio had breached 5x for the first time, and it has rarely dipped below 5 since the Great Financial Crisis. In 2022, the ratio peaked at 5.83—an all-time high.
Even with a slight pullback in 2023, the multiple remains about two times higher than it was half a century ago, signaling persistent affordability pressure.
Boom-and-Bust Cycles Leave Lasting Scars
The 2000-2006 housing boom pushed home prices up faster than incomes, inflating the ratio from 4.3 to 5.4 in just six years.
After the 2008 crash, prices corrected, trimming the multiple to 4.5 by 2009.
Yet incomes stagnated while credit conditions eased, allowing prices to roar back. Each bust resets the market, but the floor keeps rising—suggesting structural supply shortages and demographic demand that quick corrections cannot fully unwind.
Pandemic Stimulus Supercharged Home Prices
Record-low mortgage rates and a surge in remote-work moves propelled home prices in 2020-22. Median new-home prices jumped nearly $63,000 in two years—while median incomes fell slightly.
Even as interest rates climbed in 2023 and prices cooled, the typical buyer still needed more than five years of gross income to purchase a newly built home.
Unless incomes rise faster or supply meaningfully expands, the era of “stretch” affordability looks set to continue.
Median values are good for quick understanding but hide variance across the country. For more nuanced data, check out The Income Needed to Buy a Home in Every U.S. State on Voronoi, the new app from Visual Capitalist.
Tyler Durden Mon, 07/21/2025 – 22:10
Source: https://freedombunker.com/2025/07/21/the-decline-of-us-housing-affordability/
Anyone can join.
Anyone can contribute.
Anyone can become informed about their world.
"United We Stand" Click Here To Create Your Personal Citizen Journalist Account Today, Be Sure To Invite Your Friends.
Before It’s News® is a community of individuals who report on what’s going on around them, from all around the world. Anyone can join. Anyone can contribute. Anyone can become informed about their world. "United We Stand" Click Here To Create Your Personal Citizen Journalist Account Today, Be Sure To Invite Your Friends.
LION'S MANE PRODUCT
Try Our Lion’s Mane WHOLE MIND Nootropic Blend 60 Capsules
Mushrooms are having a moment. One fabulous fungus in particular, lion’s mane, may help improve memory, depression and anxiety symptoms. They are also an excellent source of nutrients that show promise as a therapy for dementia, and other neurodegenerative diseases. If you’re living with anxiety or depression, you may be curious about all the therapy options out there — including the natural ones.Our Lion’s Mane WHOLE MIND Nootropic Blend has been formulated to utilize the potency of Lion’s mane but also include the benefits of four other Highly Beneficial Mushrooms. Synergistically, they work together to Build your health through improving cognitive function and immunity regardless of your age. Our Nootropic not only improves your Cognitive Function and Activates your Immune System, but it benefits growth of Essential Gut Flora, further enhancing your Vitality.

Our Formula includes: Lion’s Mane Mushrooms which Increase Brain Power through nerve growth, lessen anxiety, reduce depression, and improve concentration. Its an excellent adaptogen, promotes sleep and improves immunity. Shiitake Mushrooms which Fight cancer cells and infectious disease, boost the immune system, promotes brain function, and serves as a source of B vitamins. Maitake Mushrooms which regulate blood sugar levels of diabetics, reduce hypertension and boosts the immune system. Reishi Mushrooms which Fight inflammation, liver disease, fatigue, tumor growth and cancer. They Improve skin disorders and soothes digestive problems, stomach ulcers and leaky gut syndrome. Chaga Mushrooms which have anti-aging effects, boost immune function, improve stamina and athletic performance, even act as a natural aphrodisiac, fighting diabetes and improving liver function. Try Our Lion’s Mane WHOLE MIND Nootropic Blend 60 Capsules Today. Be 100% Satisfied or Receive a Full Money Back Guarantee. Order Yours Today by Following This Link.


| Visits: | 1,711,604,692 |
| Stories: | 8,457,913 |
Whistler Blowers, Insiders
