
This Is A RINO Market: ‘Recession In Name Only’

CPI Completed? Check!
ATH Equity? Check!
US equity markets remain resilient, underpinned by strong cross-asset flows.
The rally appears set to extend through Labor Day, driven by:
-
Robust corporate earnings broadly exceeding expectations
-
Diverse participation from corporates, institutions, and retail investors
-
Concentrated leadership in AI, large-cap, quality, and tech names
That said, momentum may fade in September – historically, the weakest month – amid seasonality and investor re-engagement post-summer.
As Scott Rubner (former Goldman flows guru) now explains from his seat at Citadel Securities, This is a #RINO market, recession in name only…
I. Citadel Securities On-the-Ground Sentiment
Client activity remains elevated at equity market all-time highs:
-
Cash Equities: Retail net buyers in 15 of the past 17 weeks
-
Retail Options: 15-week net buying streak, 16 of last 17 weeks
-
Institutional Options: Bullish tone in 5 of the last 6 weeks
II. This Week’s Strategic Debate: When Does Cash Rotate Back into Risk Assets?
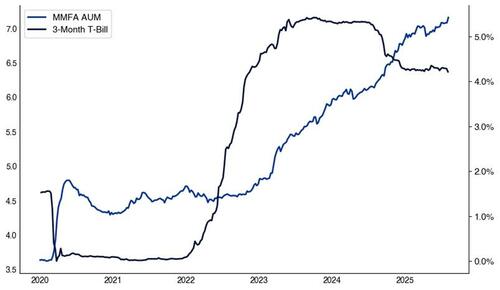
With ICI reporting money market AUM at $7.15T (up from $3.63T in early 2020), the key question becomes: what level of yields would prompt reallocation into risk assets if the Fed changes policy?
-
A 10% shift (~$700B) could energize dividend-yielding equities, high-grade credit, and risk assets, like the “January Effect” (a seasonal anomaly where equities tend to rise)
-
Q4 Rotation Watch: As rate expectations soften, this “dry powder” could power the next leg higher into the other 493 stocks in the S&P 500
Money Market Assets (trillion) vs. US Treasury 3-month money market yield (%)
January 2020 – August 2025
Source: ICI, as reported by Bloomberg and compiled by Citadel Securities, as of 8/12/25. Figures are for illustrative purposes only. Past performance figures do not guarantee future results.
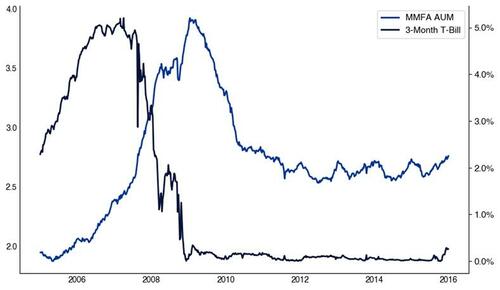
Historical Analog: In 2010, money market assets dropped -27% as yields declined—preceding a rotation into equities
Money Market Assets (trillion) vs. US Treasury 3-month money market yield (%)
January 2005 – January 2015
Source: ICI, as reported by Bloomberg and compiled by Citadel Securities, as of 8/12/25. Figures are for illustrative purposes only. Past performance figures do not guarantee future results.
III. Seasonality Watch
September Setup
-
September 3rd often marks the monthly high for SPX since 1928
-
Post-Labor Day FOMO participation typically fades, limiting buy the dip behavior
-
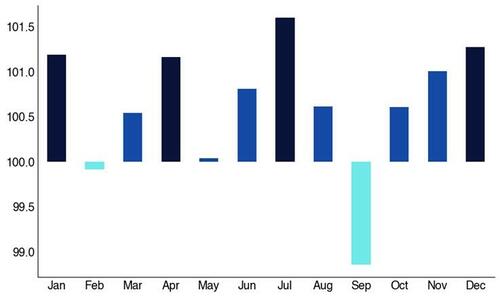
SPX and NDX historically show August strength followed by September weakness
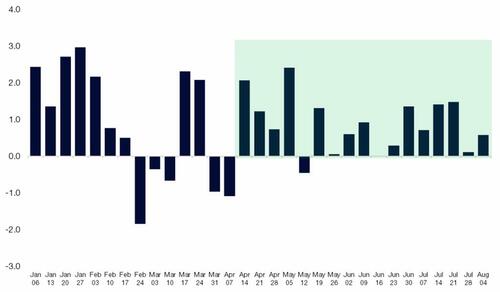
SPX 500 Monthly Performance
1928 – Today
Source: Bloomberg as compiled by Citadel Securities, as of 8/12/25. Figures are for illustrative purposes only. Past performance figures do not guarantee future results.
SPX 500 Daily Performance Quilt
1928 – Today
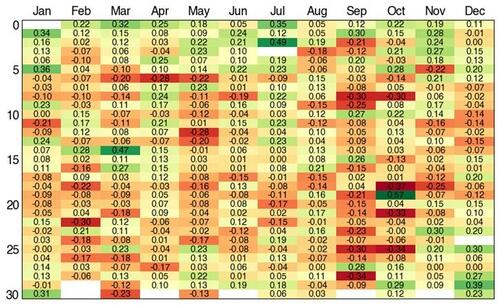
Source: Bloomberg as compiled by Citadel Securities, as of 8/12/25. Figures are for illustrative purposes only. Past performance figures do not guarantee future results.
IV. Retail Positioning
1. Citadel Securities’ retail cash equities: Net buyers in 15 of the last 17 weeks, following a soft April.
Retail Cash Equities – Net Notional by Week
STD Dev January – Aug 2025
Source: Citadel Securities, as of 8/12/25. Figures are for illustrative purposes only. Past performance figures do not guarantee future results.
2. Ongoing strength with 19 straight months of net notional and shares buying.
3. Citadel Securities’ retail cash seasonality trends based on data from August 2017- July 2025.
-
June & July = Strong
-
August = Slower
-
September = Weakest
Retail Cash – Proportion of Net Notional By Month
August 1, 2017 – July 31, 2025
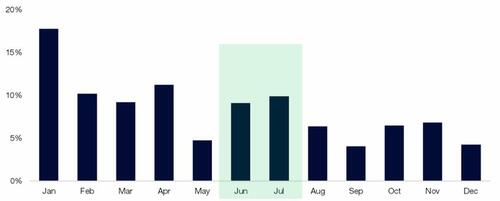
Source: Citadel Securities, as of 8/5/25. Figures are for illustrative purposes only. Past performance figures do not guarantee future results.
V. Volatility and Options Positioning
4. Retail Options Activity: July 2025 set a new monthly volume record at Citadel Securities.
Retail Options – Average Daily Volume by Month
Normalized to January 2020
Source: Citadel Securities, as of 8/12/25. Figures are for illustrative purposes only. Past performance figures do not guarantee future results.
5. Citadel Securities’ Retail Option Buying Streak
-
15-week net buying streak and 25 of the last 27 trading days.
-
Friday’s activity hit the 99th percentile, 41% above 12-month avg.
Retail Options – Put / Call Direction Ratio by Week
January – July 2025
Source: Citadel Securities, as of 8/12/25. Figures are for illustrative purposes only. Past performance figures do not guarantee future results.
6. Citadel Securities’ Bullish Retail Options Streak Watch
-
6th longest bullish options streak since 2020
-
Average duration of the top 5 streaks is 18 weeks → room for Labor Day upside?
Longest Retail Weekly Option Buying Streaks on Record, since 2020.
# of weeks
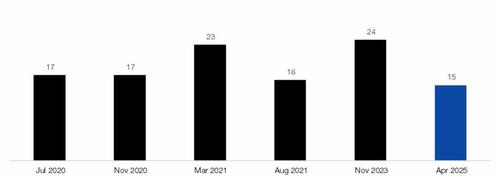
Source: Citadel Securities, as of 8/5/25. Figures are for illustrative purposes only. Past performance figures do not guarantee future results.
7. Seasonal Drop Ahead?
Citadel Securities’ retail options volume typically wanes in September.
Retail Options – Proportion of Contract Volume by Month
January 2020 – December 2024
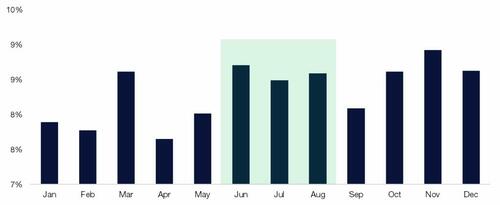
Source: Citadel Securities, as of 8/5/25. Figures are for illustrative purposes only. Past performance figures do not guarantee future results.
8. Citadel Securities Institutional Options
Bullish in 5 of the last 6 weeks, peaking at the 89th percentile. Note that Institutional Options clients moved from bearish to bullish in the last month.
Institutional Options –Call/Put Direction Ratio by Week
January – August 2025
Source: Citadel Securities, as of 8/12/25. Figures are for illustrative purposes only. Past performance figures do not guarantee future results.
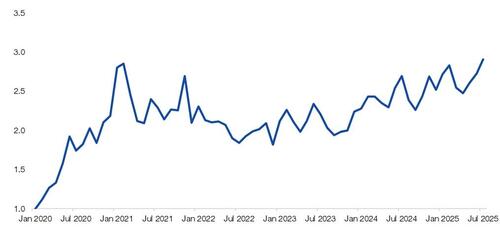
9. Volatility trend: Realized vol continues to fall. VIX at the time of typing = 15.20
-
3-month: 26
-
1-month: 9
-
1-week: 12
SPX 3-month realized volatility
August 2023 – August 2025
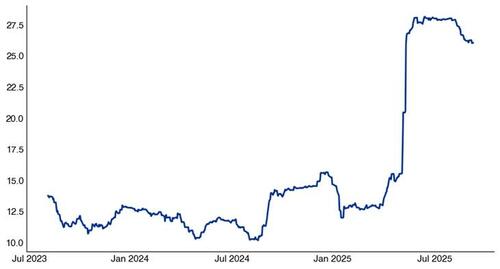
Source: Bloomberg as compiled by Citadel Securities, as of 8/12/25. Figures are for illustrative purposes only. Past performance figures do not guarantee future results.
VI. Corporate Earnings & Passive Flow Dynamics
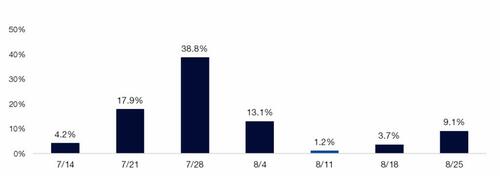
10. Q2 Earnings: 75.2% of SPX market cap has reported.
SPX Market Cap reporting by week
Q2 earnings
Source: Bloomberg as compiled by Citadel Securities, as of 8/5/25. Figures are for illustrative purposes only. Past performance figures do not guarantee future results.
11. Surging Corporate Buybacks
According to Birinyi Associates, US corporates have announced $983 billion worth of authorizations YTD, which makes it the best start to the year on record. In addition, corporate executions are on pace for $1.1 trillion, which would also set a record.
US companies announced share repurchases totaling $166 billion last month, the highest dollar value on record for July. The prior record was $88 billion in July 2006.
12. 2025 Corporate Daily Flow Math: $1.1 trillion over 251 trading days → $4.4 billion/day in equity demand, according to Birinyi Associates. August is historically one of the best months of the year for executions.
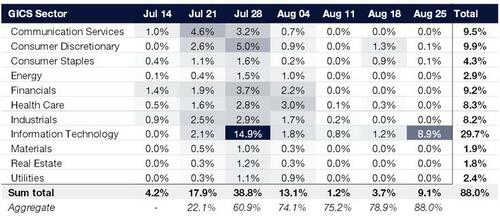
13. Sector reporting concludes, ending with Nvidia on 8/27.
SPX GICS Sector by Market Cap
Earnings reporting schedule
Source: Bloomberg as compiled by Citadel Securities, as of 8/12/25. Figures are for illustrative purposes only. Past performance figures do not guarantee future results.
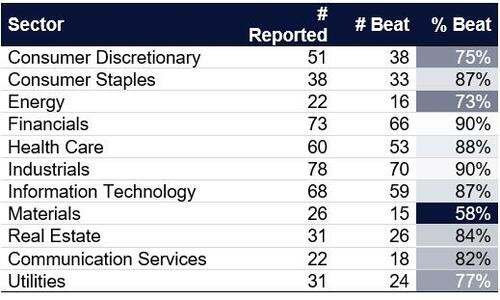
14. Q2 EPS Growth: +11.4% vs. 5% expected — strongest since Q2 2021
- According to Bloomberg, Q2 EPS beat rate of 81% exceeds the 10-year average of 74%.
SPX Earnings Reporting
As of August 12, 2025
Source: Bloomberg as compiled by Citadel Securities, as of 8/12/25. Figures are for illustrative purposes only. Past performance figures do not guarantee future results.
Key Insight: Concentration = Earnings beats → passive inflows → price momentum.
Sector Concentration Observations:
Here are the 11 S&P 500 GICs sectors for the S&P 500 market capitalization index (‘SPX’) and S&P 500 equal weighted index (‘SPW’).
Tech weighting in SPX: 34.3% vs. 13.8% in SPW → +20.5% spread
11 S&P 500 GICs sectors by SPX % market capitalization:
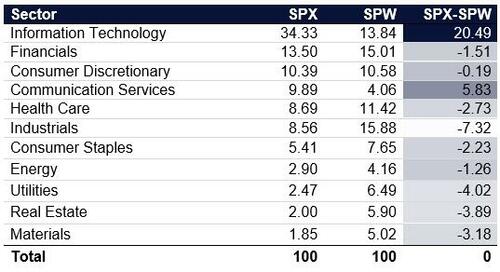
Source: Bloomberg as compiled by Citadel Securities, as of 8/12/25. Figures are for illustrative purposes only. Past performance figures do not guarantee future results.
This concentration intensifies passive flows into a narrower band of equities; this drives “Magnificent 7” vs. remaining 493.
-
Semiconductors: 13.7% (SPX) vs. 3.9% (SPW)
-
Software: 11.6% (SPX) vs. 3.9% (SPW)
→ This narrow breadth in the top names, has created more frequent unwinds and squeezes on the short leg of the pair trade.
Top 12 S&P 500 GICs industries by SPX % market capitalization:
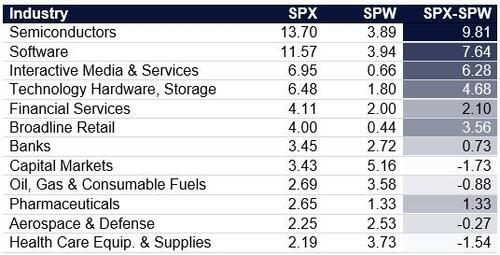
Source: Bloomberg as compiled by Citadel Securities, as of 8/12/25. Figures are for illustrative purposes only. Past performance figures do not guarantee future results.
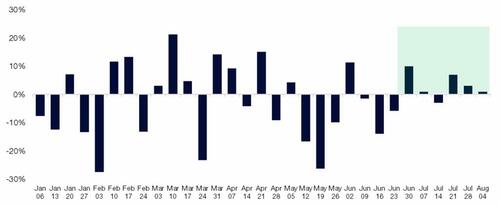
15. August Positivity Bias
The S&P 500 peaks around September 3rd, going back to 1928.
The final week of August often coincides with low positioning due to vacations, BBQ parties, contributing to upward drift in stocks, especially in low-volume environments.
SPX August Daily Performance
Since 1928
Source: Bloomberg as compiled by Citadel Securities, as of 8/5/25. Figures are for illustrative purposes only. Past performance figures do not guarantee future results.
NDX August Daily Performance
Since 1985
Source: Bloomberg as compiled by Citadel Securities, as of 8/5/25. Figures are for illustrative purposes only. Past performance figures do not guarantee future results.
VII. Institutional Positioning and Systematic Re-Leveraging
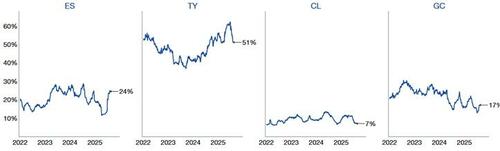
16. CTA’s: We estimate trend followers are now near fully exposed heading into late August, suggesting limited incremental upside. Our model indicates this cohort is no longer adding exposure at current levels
US Equity Aggregate CTA Positioning
January 2024 – July 2025
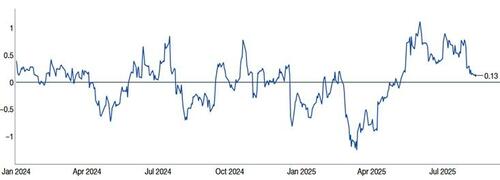
Source: Citadel Securities, as of 8/12/25. Figures are for illustrative purposes only. Past performance figures do not guarantee future results.
US CTA Signals
January 2024 – July 2025
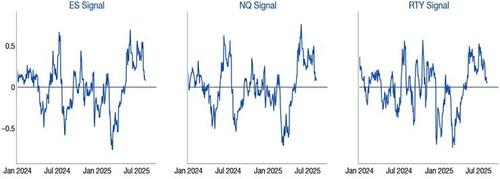
Source: Citadel Securities, as of 8/12/25. Figures are for illustrative purposes only. Past performance figures do not guarantee future results.
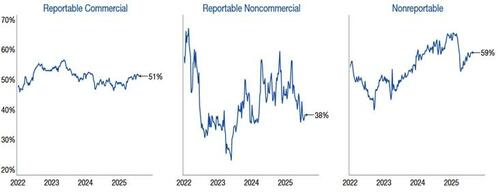
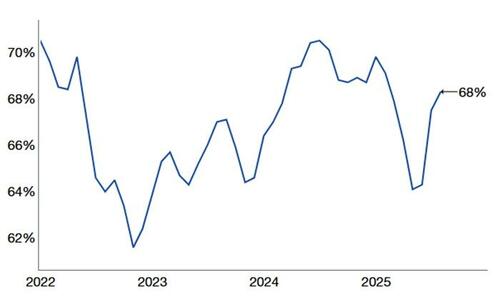
17. CFTC Net Longs: Continued increase in positioning back to historical levels.
CFTC S&P 500 Consolidated % Long
January 2022 – July 2025
Source: COT report, as compiled by Citadel Securities, as of 8/11/25. Figures are for illustrative purposes only. Past performance figures do not guarantee future results.
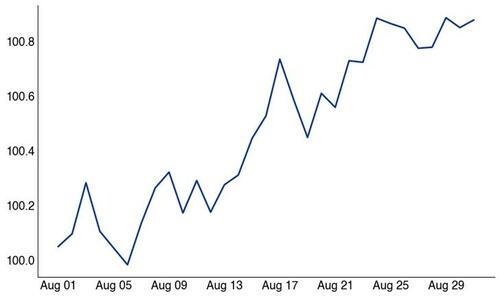
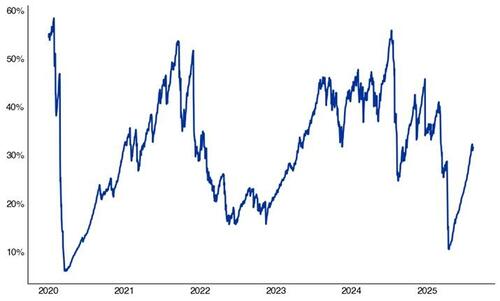
18. Vol-Control strategies – which take cues from the realized volatility market – have already increased exposure substantially.
5% risk target: 32% exposure (up from 10% in April)
Vol Target Exposure with 5% Risk Control
Exposure Rank since 2020
Source: Bloomberg as compiled by Citadel Securities, as of 8/12/25. Figures are for illustrative purposes only. Past performance figures do not guarantee future results.
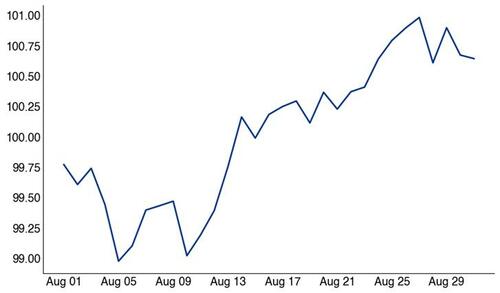
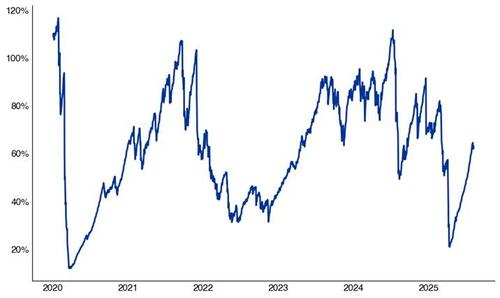
19. 10% volatility target strategies are now at 63% exposure (up from 20% in April)
Vol Target Exposure with 10% Risk Control
Exposure Rank since 2020
Source: Bloomberg as compiled by Citadel Securities, as of 8/12/25. Figures are for illustrative purposes only. Past performance figures do not guarantee future results.
20. Risk Parity strategies – driven by cross-asset volatility – now hold equity exposure near their 3-year average of 25% exposure.
Systematic positioning remains elevated → watch for volatility moves, as flows skew moves to the downside.
Risk Parity Exposure
Jan 2022 – July 2025
Source: Citadel Securities, as of 8/5/25. Figures are for illustrative purposes only. Past performance figures do not guarantee future results.
21. Sentiment Normalization: AAII allocations back to historical averages → less upside from sentiment alone.
AAII Stock Allocation (%)
Jan 2022 – July 2025
Source: AAII, as reported by Bloomberg and compiled by Citadel Securities, as of 8/12/25. Figures are for illustrative purposes only. Past performance figures do not guarantee future results.
GMI | September Tactical Checklist
Systematic strategies (CTA/Vol-Control) near max exposure → headline and economic risks
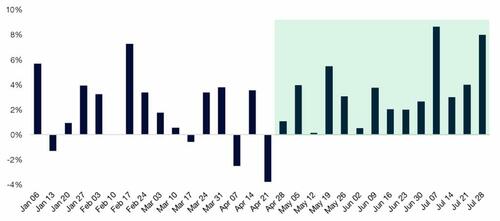
September = statistically weakest month for SPX (since 1928)
Volatility rises historically in September (since 1990)
VIX August Monthly Performance
Since 1990
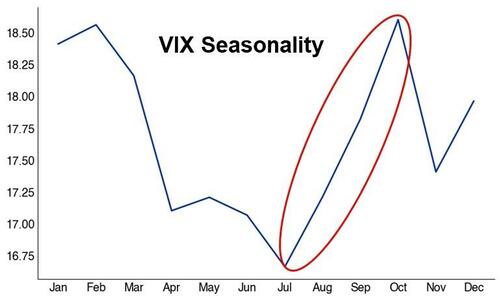
Source: Citadel Securities, as of 8/5/25. Figures are for illustrative purposes only. Past performance figures do not guarantee future results.
Retail participation wanes across cash and options
Cyclicals and high beta may mean revert
Anti-momentum rotation risk remains high
Tyler Durden Wed, 08/13/2025 – 14:40
Source: https://freedombunker.com/2025/08/13/this-is-a-rino-market-recession-in-name-only/
Anyone can join.
Anyone can contribute.
Anyone can become informed about their world.
"United We Stand" Click Here To Create Your Personal Citizen Journalist Account Today, Be Sure To Invite Your Friends.
Before It’s News® is a community of individuals who report on what’s going on around them, from all around the world. Anyone can join. Anyone can contribute. Anyone can become informed about their world. "United We Stand" Click Here To Create Your Personal Citizen Journalist Account Today, Be Sure To Invite Your Friends.
LION'S MANE PRODUCT
Try Our Lion’s Mane WHOLE MIND Nootropic Blend 60 Capsules
Mushrooms are having a moment. One fabulous fungus in particular, lion’s mane, may help improve memory, depression and anxiety symptoms. They are also an excellent source of nutrients that show promise as a therapy for dementia, and other neurodegenerative diseases. If you’re living with anxiety or depression, you may be curious about all the therapy options out there — including the natural ones.Our Lion’s Mane WHOLE MIND Nootropic Blend has been formulated to utilize the potency of Lion’s mane but also include the benefits of four other Highly Beneficial Mushrooms. Synergistically, they work together to Build your health through improving cognitive function and immunity regardless of your age. Our Nootropic not only improves your Cognitive Function and Activates your Immune System, but it benefits growth of Essential Gut Flora, further enhancing your Vitality.

Our Formula includes: Lion’s Mane Mushrooms which Increase Brain Power through nerve growth, lessen anxiety, reduce depression, and improve concentration. Its an excellent adaptogen, promotes sleep and improves immunity. Shiitake Mushrooms which Fight cancer cells and infectious disease, boost the immune system, promotes brain function, and serves as a source of B vitamins. Maitake Mushrooms which regulate blood sugar levels of diabetics, reduce hypertension and boosts the immune system. Reishi Mushrooms which Fight inflammation, liver disease, fatigue, tumor growth and cancer. They Improve skin disorders and soothes digestive problems, stomach ulcers and leaky gut syndrome. Chaga Mushrooms which have anti-aging effects, boost immune function, improve stamina and athletic performance, even act as a natural aphrodisiac, fighting diabetes and improving liver function. Try Our Lion’s Mane WHOLE MIND Nootropic Blend 60 Capsules Today. Be 100% Satisfied or Receive a Full Money Back Guarantee. Order Yours Today by Following This Link.


| Visits: | 1,722,796,707 |
| Stories: | 8,483,865 |
Whistler Blowers, Insiders
