
West Virginia Is America’s Fattest State

More than one in three adults is obese in most U.S. states, according to the latest CDC data. In several Southern states, the rate now exceeds 40%.
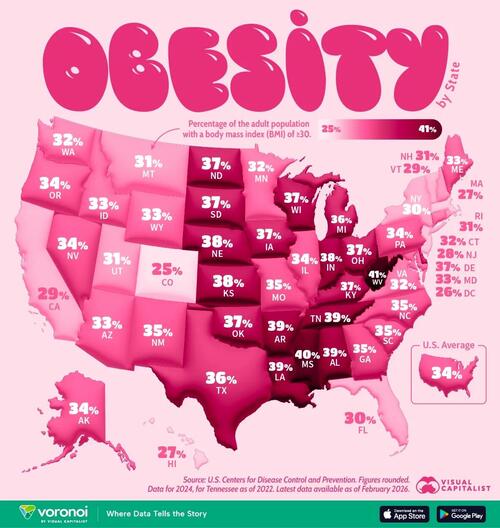
This map, via Visual Capitalist’s Bruno Venditti, shows the percentage of adults with a body mass index (BMI) of 30 or higher across all 50 states and U.S. territories.
The Highest Obesity Rates Are Concentrated in the South
West Virginia tops the list, with 41.4% of adults classified as obese. Mississippi follow at 40.4%, while Alabama, Arkansas, Louisiana, and Tennessee each report rates of roughly 39%.
| Rank | State or Territory | Adult Obesity Rate (2024) |
|---|---|---|
| 1 | West Virginia | 41.4% |
| 2 | Mississippi | 40.4% |
| 3 | Guam | 40.2% |
| 4 | Louisiana | 39.2% |
| 5 | Tennessee* | 38.9% |
| 6 | Alabama | 38.9% |
| 7 | Arkansas | 38.9% |
| 8 | Indiana | 38.4% |
| 9 | Virgin Islands | 37.7% |
| 10 | Kansas | 37.6% |
| 11 | Nebraska | 37.6% |
| 12 | Wisconsin | 37.4% |
| 13 | Kentucky | 37.2% |
| 14 | South Dakota | 37.0% |
| 15 | Ohio | 36.9% |
| 16 | North Dakota | 36.8% |
| 17 | Oklahoma | 36.8% |
| 18 | Delaware | 36.6% |
| 19 | Iowa | 36.6% |
| 20 | Puerto Rico | 36.2% |
| 21 | Michigan | 36.1% |
| 22 | Texas | 35.6% |
| 23 | Georgia | 35.4% |
| 24 | Missouri | 34.6% |
| 25 | South Carolina | 34.6% |
| 26 | New Mexico | 34.5% |
| 27 | North Carolina | 34.5% |
| 28 | Illinois | 34.2% |
| 29 | Nevada | 34.2% |
| 30 | Pennsylvania | 34.2% |
| 31 | Alaska | 34.0% |
| 32 | Oregon | 33.5% |
| 33 | Arizona | 33.3% |
| 34 | Maine | 33.2% |
| 35 | Idaho | 32.7% |
| 36 | Maryland | 32.7% |
| 37 | Wyoming | 32.5% |
| 38 | Minnesota | 32.3% |
| 39 | Virginia | 32.3% |
| 40 | Connecticut | 32.0% |
| 41 | Washington | 31.5% |
| 42 | New Hampshire | 31.1% |
| 43 | Rhode Island | 31.1% |
| 44 | Montana | 31.0% |
| 45 | Utah | 31.0% |
| 46 | Florida | 29.6% |
| 47 | New York | 29.5% |
| 48 | California | 29.1% |
| 49 | Vermont | 29.0% |
| 50 | New Jersey | 27.7% |
| 51 | Hawaii | 27.0% |
| 52 | Massachusetts | 27.0% |
| 53 | District of Columbia | 25.5% |
| 54 | Colorado | 25.0% |
| – |  U.S. State and Territory Average U.S. State and Territory Average |
34.1% |
*Note: Data for Tennessee is from 2022.
Much of the Southeast and parts of Appalachia cluster near the top of the rankings. These regions have historically faced higher poverty rates, limited healthcare access, and lower levels of physical activity. Diet patterns and food accessibility also play a role, particularly in rural communities.
The West and Northeast Report Lower Rates
Colorado stands out with the lowest adult obesity rate at 25%, followed by the District of Columbia at 25.5%. Hawaii and Massachusetts both come in at 27%, while New Jersey posts 27.7%.
Western states tend to report lower rates overall, with many in the low 30% range. Higher levels of outdoor recreation, urban density, and public health initiatives may contribute to these comparatively lower figures.
Nearly Every State Is Above 30%
A striking pattern emerges from the data: obesity is widespread across the country. Aside from a handful of states and jurisdictions, most report rates of 30% or higher.
Midwestern states such as Ohio (36.9%), Wisconsin (37.4%), and Indiana (38.4%) also report elevated rates.
Rising obesity rates are closely tied to increased healthcare costs and higher risks of conditions like diabetes, heart disease, and certain cancers.
To learn more about healthcare, check out this graphic on America’s most common drugs.
Tyler Durden Tue, 03/17/2026 – 05:45
Source: https://freedombunker.com/2026/03/17/west-virginia-is-americas-fattest-state/
Anyone can join.
Anyone can contribute.
Anyone can become informed about their world.
"United We Stand" Click Here To Create Your Personal Citizen Journalist Account Today, Be Sure To Invite Your Friends.
Before It’s News® is a community of individuals who report on what’s going on around them, from all around the world. Anyone can join. Anyone can contribute. Anyone can become informed about their world. "United We Stand" Click Here To Create Your Personal Citizen Journalist Account Today, Be Sure To Invite Your Friends.
LION'S MANE PRODUCT
Try Our Lion’s Mane WHOLE MIND Nootropic Blend 60 Capsules
Mushrooms are having a moment. One fabulous fungus in particular, lion’s mane, may help improve memory, depression and anxiety symptoms. They are also an excellent source of nutrients that show promise as a therapy for dementia, and other neurodegenerative diseases. If you’re living with anxiety or depression, you may be curious about all the therapy options out there — including the natural ones.Our Lion’s Mane WHOLE MIND Nootropic Blend has been formulated to utilize the potency of Lion’s mane but also include the benefits of four other Highly Beneficial Mushrooms. Synergistically, they work together to Build your health through improving cognitive function and immunity regardless of your age. Our Nootropic not only improves your Cognitive Function and Activates your Immune System, but it benefits growth of Essential Gut Flora, further enhancing your Vitality.

Our Formula includes: Lion’s Mane Mushrooms which Increase Brain Power through nerve growth, lessen anxiety, reduce depression, and improve concentration. Its an excellent adaptogen, promotes sleep and improves immunity. Shiitake Mushrooms which Fight cancer cells and infectious disease, boost the immune system, promotes brain function, and serves as a source of B vitamins. Maitake Mushrooms which regulate blood sugar levels of diabetics, reduce hypertension and boosts the immune system. Reishi Mushrooms which Fight inflammation, liver disease, fatigue, tumor growth and cancer. They Improve skin disorders and soothes digestive problems, stomach ulcers and leaky gut syndrome. Chaga Mushrooms which have anti-aging effects, boost immune function, improve stamina and athletic performance, even act as a natural aphrodisiac, fighting diabetes and improving liver function. Try Our Lion’s Mane WHOLE MIND Nootropic Blend 60 Capsules Today. Be 100% Satisfied or Receive a Full Money Back Guarantee. Order Yours Today by Following This Link.


| Visits: | 1,793,297,467 |
| Stories: | 8,615,418 |
Whistler Blowers, Insiders
