

How Economic Power Has Shifted Over The Past 200 Years

Over the last 200 years, economic leadership has shifted from China to the British Empire, then to the United States, and increasingly back toward Asia.
This streamgraph, via Visual Capitalist’s Gabriel Cohen, tracks how the share of global gross domestic product (GDP) held by major economies changed from 1820 to 2025. The visualization incorporates the latest available data from the Maddison Project Database, the COLDAT Colonial Dates Dataset, and the IMF’s World Economic Outlook.
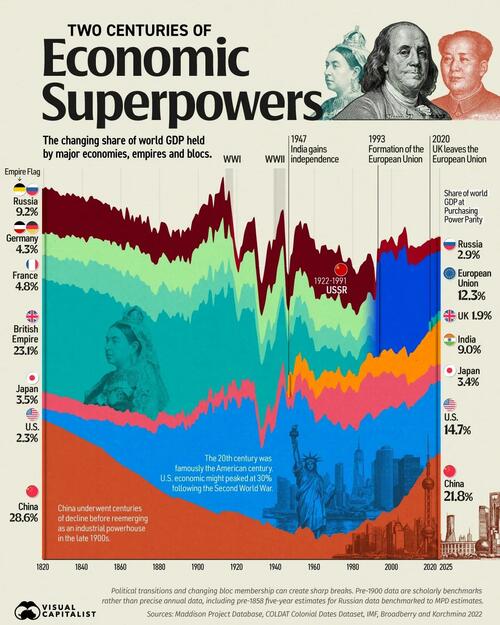
All GDP figures are adjusted for purchasing power parity (PPP), accounting for differences in living costs and production across countries.
The table below shows how each economy’s share of world GDP changed across two centuries:
| Economy | Share of World GDP (%) | ||||||
|---|---|---|---|---|---|---|---|
| 1820 | 1855 | 1890 | 1925 | 1960 | 1995 | 2025 | |
 China China |
28.6% | 21.1% | 12.7% | 8.9% | 5.3% | 9.5% | 21.8% |
 U.S. U.S. |
2.3% | 7.0% | 14.6% | 23.9% | 24.5% | 20.7% | 14.7% |
 EU EU |
— | — | — | — | — | 17.0% | 12.3% |
 India India |
— | — | — | — | 3.9% | 4.3% | 9.0% |
 Japan Japan |
3.5% | 2.9% | 2.6% | 3.8% | 4.5% | 7.9% | 3.4% |
 Russia / USSR Russia / USSR |
9.2% | 7.1% | 5.3% | 5.2% | 10.1% | 2.5% | 2.9% |
 British Empire / Britain British Empire / Britain |
23.1% | 22.6% | 20.7% | 14.7% | 6.3% | 3.2% | 1.9% |
 France France |
4.8% | 5.8% | 5.2% | 5.0% | 4.1% | — | — |
 Germany Germany |
4.3% | 4.8% | 6.4% | 6.6% | 6.7% | — | — |
Pax Britannica and the European Years
Britain was the first country in the world to industrialize. As a result, the British Empire became the world’s preeminent superpower during the 19th century, an era sometimes known as Pax Britannica because of the relative absence of conflict between the major powers.
In 1845, the British Empire, on which the sun famously “never set,” contributed nearly one-quarter (23.8%) of global GDP. India was the empire’s most economically significant possession before gaining independence in 1947.
The table below shows each economy’s peak share of world GDP, the year it reached that level, and its share in 2025:
| Economy | Peak Share (%) | Peak Year | 2025 Share (%) |
|---|---|---|---|
| U.S. |
29.7% | 1944 | 14.7% |
| China |
28.6% | 1820 | 21.8% |
| British Empire / Britain |
23.8% | 1845 | 1.9% |
| EU |
17.9% | 2007 | 12.3% |
| Russia / USSR |
10.2% | 1956 | 2.9% |
| India |
9.0% | 2025 | 9.0% |
| Germany |
8.8% | 1913 | |
| Japan |
8.6% | 1990 | 3.4% |
| France |
6.6% | 1858 |
The rest of Europe’s fortunes followed a similar trajectory. The French Empire reached its peak share in 1858, at 6.6%, while Germany peaked at 8.8% in 1913, on the eve of the First World War.
Following decades of war and declining influence on the world stage, several European economies joined together in the European Union. The bloc contributed 17.9% of global GDP in 2007, ahead of the global financial crisis, though its share later declined and was further reduced by the UK’s withdrawal in 2020.
The Fall of Empire and the Rise of the U.S.
If the 19th century was the British century, the 20th was the American century. Like Britain before it, the U.S. became the world’s largest exporter for a time.
World War II marked a turning point in global economic leadership. By 1944, the U.S. accounted for 29.7% of world GDP, the highest share reached by any economy in the modern period covered by this dataset.
American economic dominance was supported by high-value industries and the country’s central role in global finance, manufacturing, and trade.
The U.S. also continues to dominate rankings of the world’s largest and most profitable companies today. It also is still the undisputed economic powerhouse in nominal GDP terms.
The Asian Century
For centuries, China was a center of the global economy. Political instability and its failure to keep pace with European industrialization contributed to a long decline in its share of world GDP during the 19th and 20th centuries.
Beginning in the late 20th century, economic reforms and China’s emergence as a global manufacturing hub helped it regain lost ground. By 2025, China accounted for 21.8% of world GDP, or more than one-fifth of the total.
The full dataset below shows each economy’s share of world GDP for every year from 1820 to 2025:
| Year | Share of World GDP (%) | ||||||||
|---|---|---|---|---|---|---|---|---|---|
| China |
U.S. |
EU |
India |
Japan |
Russia / USSR |
British Empire / Britain |
France |
Germany |
|
| 1820 | 28.6% | 2.3% | — | — | 3.5% | 9.2% | 23.1% | 4.8% | 4.3% |
| 1821 | 28.4% | 2.4% | — | — | 3.5% | 9.2% | 23.0% | 5.2% | 4.4% |
| 1822 | 28.2% | 2.5% | — | — | 3.4% | 9.2% | 23.0% | 5.0% | 4.4% |
| 1823 | 28.1% | 2.5% | — | — | 3.4% | 9.2% | 23.0% | 5.1% | 4.4% |
| 1824 | 27.9% | 2.6% | — | — | 3.4% | 9.2% | 23.2% | 5.2% | 4.6% |
| 1825 | 27.7% | 2.7% | — | — | 3.4% | 9% | 23.2% | 5.0% | 4.6% |
| 1826 | 27.6% | 2.8% | — | — | 3.4% | 9% | 22.8% | 5.1% | 4.7% |
| 1827 | 27.4% | 2.9% | — | — | 3.4% | 9% | 23.1% | 5.0% | 4.6% |
| 1828 | 27.2% | 2.9% | — | — | 3.3% | 9% | 23.0% | 4.9% | 4.5% |
| 1829 | 27.0% | 2.9% | — | — | 3.3% | 9% | 22.9% | 5.0% | 4.5% |
| 1830 | 26.9% | 3.1% | — | — | 3.3% | 8.7% | 23.1% | 4.9% | 4.5% |
| 1831 | 26.6% | 3.4% | — | — | 3.3% | 8.7% | 23.0% | 5.0% | 4.4% |
| 1832 | 26.4% | 3.6% | — | — | 3.3% | 8.7% | 23.1% | 5.4% | 4.5% |
| 1833 | 26.2% | 3.8% | — | — | 3.3% | 8.7% | 23.0% | 5.2% | 4.7% |
| 1834 | 26.0% | 3.7% | — | — | 3.2% | 8.7% | 23.0% | 5.2% | 4.7% |
| 1835 | 25.8% | 3.9% | — | — | 3.2% | 8.4% | 23.4% | 5.4% | 4.7% |
| 1836 | 25.6% | 4.0% | — | — | 3.2% | 8.4% | 23.4% | 5.2% | 4.7% |
| 1837 | 25.4% | 4.0% | — | — | 3.2% | 8.4% | 23.2% | 5.3% | 4.7% |
| 1838 | 25.2% | 4.0% | — | — | 3.2% | 8.4% | 23.4% | 5.5% | 4.6% |
| 1839 | 25.0% | 4.2% | — | — | 3.2% | 8.4% | 23.1% | 5.3% | 4.7% |
| 1840 | 24.8% | 4.1% | — | — | 3.2% | 8.3% | 23.4% | 5.6% | 4.8% |
| 1841 | 24.6% | 4.1% | — | — | 3.1% | 8.3% | 23.1% | 5.7% | 4.9% |
| 1842 | 24.4% | 4.2% | — | — | 3.1% | 8.3% | 22.8% | 5.5% | 4.8% |
| 1843 | 24.2% | 4.3% | — | — | 3.1% | 8.3% | 23.0% | 5.8% | 4.7% |
| 1844 | 24.0% | 4.7% | — | — | 3.1% | 8.3% | 23.6% | 5.9% | 4.7% |
| 1845 | 23.8% | 4.9% | — | — | 3.1% | 8.2% | 23.8% | 5.7% | 4.8% |
| 1846 | 23.6% | 5.0% | — | — | 3.1% | 8.2% | 23.6% | 5.7% | 4.6% |
| 1847 | 23.4% | 5.2% | — | — | 3.0% | 8.2% | 23.3% | 6.2% | 4.6% |
| 1848 | 23.2% | 5.5% | — | — | 3.0% | 8.2% | 23.3% | 5.8% | 4.8% |
| 1849 | 23.0% | 5.4% | — | — | 3.0% | 8.2% | 23.2% | 5.9% | 5.0% |
| 1850 | 22.9% | 5.5% | — | — | 3.0% | 7.7% | 22.9% | 6.0% | 5.0% |
| 1851 | 22.5% | 5.9% | — | — | 3.0% | 7.7% | 22.9% | 5.8% | 4.9% |
| 1852 | 22.1% | 6.3% | — | — | 3.0% | 7.7% | 23.0% | 6.1% | 4.9% |
| 1853 | 21.8% | 6.9% | — | — | 2.9% | 7.7% | 23.0% | 5.8% | 4.8% |
| 1854 | 21.4% | 7.0% | — | — | 2.9% | 7.7% | 23.0% | 6.0% | 4.9% |
| 1855 | 21.1% | 7.0% | — | — | 2.9% | 7.1% | 22.6% | 5.8% | 4.8% |
| 1856 | 20.8% | 7.3% | — | — | 2.9% | 7.1% | 22.9% | 6.0% | 5.1% |
| 1857 | 20.4% | 7.3% | — | — | 2.9% | 7.1% | 22.7% | 6.3% | 5.3% |
| 1858 | 20.1% | 7.4% | — | — | 2.9% | 7.1% | 22.2% | 6.6% | 5.2% |
| 1859 | 19.8% | 7.7% | — | — | 2.9% | 7.1% | 22.4% | 6.1% | 5.2% |
| 1860 | 19.5% | 8.0% | — | — | 2.9% | 7.1% | 22.3% | 6.5% | 5.4% |
| 1861 | 19.2% | 8.0% | — | — | 2.9% | 6.8% | 22.0% | 6.0% | 5.2% |
| 1862 | 19.0% | 8.3% | — | — | 2.9% | 6.1% | 21.3% | 6.4% | 5.4% |
| 1863 | 18.8% | 9.0% | — | — | 2.8% | 7.3% | 21.8% | 6.6% | 5.7% |
| 1864 | 18.6% | 9.4% | — | — | 2.8% | 6.0% | 21.8% | 6.6% | 5.8% |
| 1865 | 18.3% | 9.0% | — | — | 2.8% | 5.4% | 21.7% | 6.3% | 5.8% |
| 1866 | 18.1% | 9.1% | — | — | 2.8% | 6.6% | 21.7% | 6.3% | 5.8% |
| 1867 | 17.9% | 9.5% | — | — | 2.8% | 5.6% | 21.6% | 5.8% | 5.7% |
| 1868 | 17.7% | 9.7% | — | — | 2.8% | 5.7% | 21.8% | 6.3% | 6.0% |
| 1869 | 17.4% | 10.0% | — | — | 2.8% | 5.6% | 21.6% | 6.4% | 6.0% |
| 1870 | 17.2% | 9.8% | — | — | 2.8% | 7.2% | 21.8% | 5.8% | 5.9% |
| 1871 | 16.9% | 10.1% | — | — | 2.8% | 5.9% | 21.4% | 5.7% | 5.7% |
| 1872 | 16.6% | 10.3% | — | — | 2.7% | 6.3% | 21.2% | 6.1% | 6.0% |
| 1873 | 16.3% | 10.6% | — | — | 2.7% | 6.3% | 21.1% | 5.6% | 6.1% |
| 1874 | 16.0% | 10.3% | — | — | 2.7% | 7.6% | 20.9% | 6.2% | 6.5% |
| 1875 | 15.7% | 10.7% | — | — | 2.6% | 5.8% | 20.9% | 6.2% | 6.4% |
| 1876 | 15.4% | 10.6% | — | — | 2.6% | 5.8% | 20.6% | 5.6% | 6.2% |
| 1877 | 15.1% | 10.7% | — | — | 2.6% | 7.1% | 20.4% | 5.8% | 6.1% |
| 1878 | 14.8% | 11.0% | — | — | 2.6% | 7.3% | 20.1% | 5.6% | 6.2% |
| 1879 | 14.6% | 12.1% | — | — | 2.6% | 6.1% | 20.0% | 5.2% | 6.0% |
| 1880 | 14.3% | 13.3% | — | — | 2.6% | 5.6% | 20.2% | 5.5% | 5.8% |
| 1881 | 14.0% | 13.5% | — | — | 2.6% | 7.1% | 20.3% | 5.7% | 5.8% |
| 1882 | 13.8% | 14.1% | — | — | 2.6% | 6.1% | 20.7% | 5.8% | 5.8% |
| 1883 | 13.5% | 14.1% | — | — | 2.5% | 6.3% | 20.6% | 5.7% | 6.0% |
| 1884 | 13.3% | 14.1% | — | — | 2.5% | 6.2% | 20.4% | 5.5% | 6.0% |
| 1885 | 13.1% | 13.9% | — | — | 2.5% | 5.5% | 20.2% | 5.3% | 6.1% |
| 1886 | 12.8% | 14.1% | — | — | 2.6% | 5.2% | 19.8% | 5.3% | 6.0% |
| 1887 | 12.6% | 14.4% | — | — | 2.6% | 6.1% | 20.4% | 5.2% | 6.1% |
| 1888 | 12.6% | 14.1% | — | — | 2.4% | 5.8% | 20.6% | 5.2% | 6.2% |
| 1889 | 12.7% | 14.7% | — | — | 2.5% | 5.4% | 20.5% | 5.2% | 6.3% |
| 1890 | 12.7% | 14.6% | — | — | 2.6% | 5.3% | 20.7% | 5.2% | 6.4% |
| 1891 | 12.5% | 14.9% | — | — | 2.4% | 4.8% | 19.6% | 5.3% | 6.2% |
| 1892 | 12.3% | 16.1% | — | — | 2.5% | 5.2% | 19.6% | 5.3% | 6.4% |
| 1893 | 12.2% | 15.0% | — | — | 2.5% | 5.9% | 19.4% | 5.3% | 6.6% |
| 1894 | 12.0% | 14.3% | — | — | 2.7% | 6.6% | 19.8% | 5.4% | 6.6% |
| 1895 | 11.9% | 15.7% | — | — | 2.7% | 6.1% | 19.5% | 5.2% | 6.8% |
| 1896 | 11.7% | 15.1% | — | — | 2.5% | 6.7% | 18.9% | 5.3% | 6.9% |
| 1897 | 11.6% | 16.2% | — | — | 2.5% | 6.5% | 20.1% | 5.1% | 7.0% |
| 1898 | 11.4% | 16.3% | — | — | 2.9% | 6.6% | 20.3% | 5.3% | 7.1% |
| 1899 | 11.2% | 17.4% | — | — | 2.7% | 7.0% | 19.7% | 5.5% | 7.2% |
| 1900 | 11.1% | 17.5% | — | — | 2.7% | 6.8% | 19.6% | 5.3% | 7.4% |
| 1901 | 10.9% | 19.2% | — | — | 2.7% | 7.0% | 19.5% | 5.1% | 7.1% |
| 1902 | 10.7% | 19.1% | — | — | 2.5% | 7.6% | 20.2% | 5.0% | 7.2% |
| 1903 | 10.6% | 19.7% | — | — | 2.8% | 7.1% | 20.1% | 5.0% | 7.4% |
| 1904 | 10.4% | 19.1% | — | — | 2.7% | 7.8% | 19.9% | 5.0% | 7.6% |
| 1905 | 10.2% | 20.2% | — | — | 2.6% | 6.9% | 19.8% | 5.0% | 7.7% |
| 1906 | 10.0% | 22.2% | — | — | 2.9% | 6.6% | 20.2% | 5.0% | 7.8% |
| 1907 | 9.9% | 22.2% | — | — | 2.9% | 6.4% | 19.7% | 5.1% | 8.0% |
| 1908 | 9.7% | 20.1% | — | — | 2.9% | 7.0% | 19.1% | 5.0% | 8.0% |
| 1909 | 9.5% | 22.0% | — | — | 2.8% | 7.2% | 20.1% | 5.1% | 8.0% |
| 1910 | 9.4% | 21.7% | — | — | 2.8% | 7.8% | 20.2% | 4.7% | 8.2% |
| 1911 | 9.3% | 22.0% | — | — | 2.9% | 7.2% | 20.2% | 5.1% | 8.3% |
| 1912 | 9.6% | 22.5% | — | — | 2.9% | 7.8% | 20.1% | 5.5% | 8.5% |
| 1913 | 10.0% | 22.9% | — | — | 2.9% | 8.2% | 20.1% | 5.3% | 8.8% |
| 1914 | 9.9% | 20.6% | — | — | 2.8% | 7.7% | 20.2% | 4.9% | 7.3% |
| 1915 | 9.9% | 20.8% | — | — | 3.0% | 7.8% | 20.3% | 4.7% | 6.9% |
| 1916 | 9.9% | 23.1% | — | — | 3.4% | 6.8% | 20.5% | 4.9% | 6.8% |
| 1917 | 9.8% | 22.1% | — | — | 3.5% | 5.8% | 20.1% | 4.1% | 6.7% |
| 1918 | 9.8% | 23.5% | — | — | 3.5% | 3.5% | 18.8% | 3.1% | 6.6% |
| 1919 | 9.8% | 23.2% | — | — | 3.8% | 3.0% | 16.3% | 3.6% | 5.3% |
| 1920 | 9.7% | 22.5% | — | — | 3.4% | 2.9% | 14.5% | 4.2% | 5.6% |
| 1921 | 9.5% | 21.4% | — | — | 3.7% | 2.6% | 14.1% | 3.9% | 6.1% |
| 1922 | 9.4% | 21.9% | — | — | 3.7% | 2.9% | 14.7% | 4.5% | 6.5% |
| 1923 | 9.2% | 24.1% | — | — | 3.6% | 3.3% | 14.3% | 4.6% | 5.3% |
| 1924 | 9.0% | 24.1% | — | — | 3.7% | 4.2% | 14.6% | 5.1% | 6.0% |
| 1925 | 8.9% | 23.9% | — | — | 3.8% | 5.2% | 14.7% | 5.0% | 6.6% |
| 1926 | 8.7% | 24.8% | — | — | 3.7% | 5.8% | 14.4% | 5.0% | 6.6% |
| 1927 | 8.5% | 24.3% | — | — | 3.6% | 6.1% | 14.6% | 4.8% | 7.1% |
| 1928 | 8.4% | 23.9% | — | — | 3.8% | 6.4% | 14.5% | 5.0% | 7.2% |
| 1929 | 8.2% | 24.6% | — | — | 3.9% | 6.4% | 14.7% | 5.2% | 7.0% |
| 1930 | 8.2% | 21.8% | — | — | 3.5% | 6.6% | 14.4% | 5.0% | 6.8% |
| 1931 | 8.0% | 19.9% | — | — | 3.5% | 6.6% | 13.7% | 4.5% | 6.1% |
| 1932 | 8.1% | 16.5% | — | — | 3.7% | 6.4% | 13.4% | 4.2% | 5.5% |
| 1933 | 7.1% | 15.6% | — | — | 3.9% | 6.5% | 13.2% | 4.3% | 5.8% |
| 1934 | 7.1% | 16.5% | — | — | 3.8% | 7.0% | 13.4% | 4.2% | 6.1% |
| 1935 | 7.5% | 18.2% | — | — | 3.9% | 7.8% | 12.9% | 4.0% | 6.4% |
| 1936 | 7.8% | 19.5% | — | — | 4.0% | 8.3% | 13.2% | 4.1% | 6.8% |
| 1937 | 7.4% | 20.5% | — | — | 4.1% | 8.9% | 13.0% | 4.2% | 7.1% |
| 1938 | 7.0% | 18.8% | — | — | 4.2% | 8.8% | 12.8% | 4.1% | 7.5% |
| 1939 | 6.8% | 19.7% | — | — | 4.7% | 9.2% | 12.7% | 4.3% | 8.0% |
| 1940 | 6.5% | 20.8% | — | — | 4.7% | 8.8% | 13.1% | 3.5% | 7.9% |
| 1941 | 6.4% | 23.5% | — | — | 4.8% | 8.3% | 13.7% | 2.7% | 8.3% |
| 1942 | 6.2% | 25.8% | — | — | 4.8% | 7.9% | 13.8% | 2.4% | 8.3% |
| 1943 | 6.1% | 27.9% | — | — | 4.7% | 7.6% | 14.0% | 2.3% | 8.4% |
| 1944 | 6.0% | 29.7% | — | — | 4.7% | 7.2% | 13.5% | 1.9% | 8.5% |
| 1945 | 5.8% | 28.8% | — | — | 3.5% | 6.8% | 12.9% | 2.0% | 6.0% |
| 1946 | 5.7% | 25.9% | — | — | 2.6% | 6.5% | 12.2% | 3.0% | 2.8% |
| 1947 | 5.5% | 25.2% | — | 4.2% | 2.6% | 7.2% | 7.0% | 3.3% | 3.1% |
| 1948 | 5.4% | 26.2% | — | 4.2% | 2.8% | 8.1% | 8.0% | 3.5% | 3.7% |
| 1949 | 5.3% | 25.4% | — | 4.2% | 2.8% | 8.9% | 8.2% | 3.9% | 4.2% |
| 1950 | 5.2% | 27.4% | — | 4.2% | 3.0% | 9.6% | 8.1% | 4.2% | 5.0% |
| 1951 | 6.0% | 28.2% | — | 4.1% | 3.3% | 9.2% | 8.0% | 4.2% | 5.2% |
| 1952 | 6.4% | 27.9% | — | 4.0% | 3.5% | 9.4% | 7.7% | 4.1% | 5.4% |
| 1953 | 6.9% | 27.9% | — | 4.1% | 3.6% | 9.4% | 7.6% | 4.1% | 5.6% |
| 1954 | 6.2% | 26.5% | — | 4.1% | 3.6% | 9.4% | 7.7% | 4.1% | 5.8% |
| 1955 | 6.4% | 27.1% | — | 4.0% | 3.7% | 9.7% | 7.6% | 4.1% | 6.1% |
| 1956 | 6.7% | 26.4% | — | 4.0% | 3.8% | 10.2% | 7.3% | 4.1% | 6.2% |
| 1957 | 6.5% | 25.7% | — | 3.8% | 3.9% | 9.9% | 7.0% | 4.2% | 6.3% |
| 1958 | 6.3% | 24.3% | — | 3.9% | 4.0% | 10.2% | 6.7% | 4.1% | 6.3% |
| 1959 | 5.8% | 25.0% | — | 3.8% | 4.2% | 9.6% | 6.7% | 4.0% | 6.5% |
| 1960 | 5.3% | 24.5% | — | 3.9% | 4.5% | 10.1% | 6.3% | 4.1% | 6.7% |
| 1961 | 4.1% | 23.8% | — | 3.8% | 4.8% | 10.1% | 6.1% | 4.1% | 6.6% |
| 1962 | 4.2% | 24.0% | — | 3.7% | 5.0% | 9.9% | 5.7% | 4.2% | 6.6% |
| 1963 | 4.6% | 23.9% | — | 3.7% | 5.1% | 9.2% | 5.3% | 4.2% | 6.4% |
| 1964 | 4.9% | 24.0% | — | 3.8% | 5.4% | 9.9% | 5.3% | 4.3% | 6.5% |
| 1965 | 5.2% | 24.3% | — | 3.5% | 5.5% | 9.9% | 5.1% | 4.2% | 6.5% |
| 1966 | 5.2% | 24.6% | — | 3.3% | 5.8% | 9.9% | 5.0% | 4.2% | 6.3% |
| 1967 | 4.9% | 24.0% | — | 3.4% | 6.1% | 9.9% | 4.8% | 4.2% | 6.0% |
| 1968 | 4.6% | 23.9% | — | 3.4% | 6.5% | 9.9% | 4.7% | 4.2% | 6.1% |
| 1969 | 4.8% | 23.5% | — | 3.4% | 7.0% | 9.6% | 4.6% | 4.3% | 6.2% |
| 1970 | 5.2% | 22.4% | — | 3.4% | 7.4% | 9.8% | 4.5% | 4.3% | 6.1% |
| 1971 | 5.3% | 22.2% | — | 3.3% | 7.4% | 9.7% | 4.3% | 4.3% | 6.1% |
| 1972 | 5.2% | 22.6% | — | 3.2% | 7.8% | 9.4% | 4.3% | 4.4% | 6.1% |
| 1973 | 5.4% | 22.9% | — | 3.2% | 8.1% | 9.8% | 4.4% | 4.4% | 6.1% |
| 1974 | 5.4% | 22.0% | — | 3.1% | 7.7% | 9.7% | 4.2% | 4.4% | 6.0% |
| 1975 | 5.5% | 21.2% | — | 3.3% | 7.6% | 9.4% | 4.1% | 4.2% | 5.7% |
| 1976 | 5.1% | 21.4% | — | 3.2% | 7.6% | 9.5% | 4.0% | 4.2% | 5.8% |
| 1977 | 5.2% | 21.6% | — | 3.3% | 7.7% | 9.3% | 3.9% | 4.2% | 5.7% |
| 1978 | 5.6% | 22.0% | — | 3.4% | 7.8% | 9.2% | 3.9% | 4.2% | 5.6% |
| 1979 | 5.8% | 21.9% | — | 3.1% | 7.9% | 8.8% | 3.9% | 4.2% | 5.7% |
| 1980 | 5.9% | 21.1% | — | 3.2% | 7.8% | 8.5% | 3.6% | 4.1% | 5.5% |
| 1981 | 5.9% | 21.0% | — | 3.3% | 7.8% | 8.3% | 3.5% | 4.0% | 5.4% |
| 1982 | 6.3% | 20.0% | — | 3.3% | 7.8% | 8.3% | 3.4% | 4.0% | 5.2% |
| 1983 | 6.5% | 20.2% | — | 3.4% | 7.8% | 8.3% | 3.5% | 3.9% | 5.1% |
| 1984 | 7.0% | 21.1% | — | 3.5% | 7.8% | 8.2% | 3.4% | 3.8% | 5.1% |
| 1985 | 7.4% | 21.2% | — | 3.5% | 8.0% | 8.0% | 3.5% | 3.8% | 5.0% |
| 1986 | 7.7% | 21.3% | — | 3.5% | 8.0% | 8.1% | 3.5% | 3.8% | 5.0% |
| 1987 | 8.1% | 21.4% | — | 3.6% | 8.0% | 8.0% | 3.5% | 3.7% | 4.9% |
| 1988 | 8.3% | 21.7% | — | 3.9% | 8.3% | 7.9% | 3.6% | 3.8% | 5.0% |
| 1989 | 8.1% | 21.8% | — | 4.0% | 8.4% | 7.8% | 3.6% | 3.8% | 5.0% |
| 1990 | 7.9% | 21.5% | — | 4.1% | 8.6% | 7.4% | 3.5% | 3.8% | 4.7% |
| 1991 | 7.9% | 20.7% | — | 4.0% | 8.6% | 6.8% | 3.4% | 3.7% | 4.8% |
| 1992 | 8.2% | 20.8% | — | 4.0% | 8.4% | 3.4% | 3.2% | 3.7% | 4.8% |
| 1993 | 8.7% | 20.6% | 15.8% | 4.1% | 8.1% | 3.1% | 3.2% | — | — |
| 1994 | 9.0% | 20.8% | 15.8% | 4.2% | 7.9% | 2.6% | 3.2% | — | — |
| 1995 | 9.5% | 20.7% | 17.0% | 4.3% | 7.9% | 2.5% | 3.2% | — | — |
| 1996 | 9.8% | 20.8% | 16.8% | 4.5% | 7.8% | 2.4% | 3.2% | — | — |
| 1997 | 9.8% | 21.0% | 16.8% | 4.5% | 7.7% | 2.4% | 3.2% | — | — |
| 1998 | 9.5% | 21.2% | 16.9% | 4.6% | 7.3% | 2.2% | 3.1% | — | — |
| 1999 | 9.6% | 21.5% | 16.9% | 4.7% | 7.1% | 2.4% | 3.1% | — | — |
| 2000 | 9.9% | 21.6% | 17.1% | 4.7% | 7.0% | 2.6% | 3.1% | — | — |
| 2001 | 10.2% | 21.0% | 16.9% | 4.7% | 6.8% | 2.7% | 3.1% | — | — |
| 2002 | 10.5% | 20.5% | 16.5% | 4.7% | 6.5% | 2.7% | 3.0% | — | — |
| 2003 | 10.7% | 20.2% | 16.1% | 4.8% | 6.3% | 2.9% | 3.0% | — | — |
| 2004 | 11.1% | 20.2% | 17.6% | 5.0% | 6.2% | 3.0% | 3.0% | — | — |
| 2005 | 11.7% | 20.0% | 17.4% | 5.1% | 6.1% | 3.2% | 3.0% | — | — |
| 2006 | 12.4% | 19.7% | 17.4% | 5.3% | 5.9% | 3.4% | 2.9% | — | — |
| 2007 | 13.0% | 19.3% | 17.9% | 5.5% | 5.8% | 3.6% | 2.9% | — | — |
| 2008 | 13.0% | 18.5% | 17.5% | 5.6% | 5.5% | 3.7% | 2.7% | — | — |
| 2009 | 13.4% | 17.2% | 16.2% | 5.8% | 5.0% | 3.4% | 2.5% | — | — |
| 2010 | 14.3% | 17.0% | 16.0% | 6.0% | 5.0% | 3.5% | 2.4% | — | — |
| 2011 | 14.7% | 16.6% | 15.8% | 6.2% | 4.8% | 3.6% | 2.4% | — | — |
| 2012 | 15.3% | 16.4% | 15.2% | 6.3% | 4.7% | 3.6% | 2.3% | — | — |
| 2013 | 16.0% | 16.2% | 14.7% | 6.4% | 4.6% | 3.5% | 2.3% | — | — |
| 2014 | 16.6% | 16.0% | 14.5% | 6.7% | 4.5% | 3.4% | 2.3% | — | — |
| 2015 | 17.1% | 15.8% | 14.3% | 6.9% | 4.4% | 3.2% | 2.3% | — | — |
| 2016 | 17.7% | 15.6% | 14.1% | 7.3% | 4.3% | 3.1% | 2.2% | — | — |
| 2017 | 18.2% | 15.4% | 14.0% | 7.5% | 4.2% | 3.1% | 2.2% | — | — |
| 2018 | 18.8% | 15.3% | 13.8% | 7.7% | 4.1% | 3.0% | 2.2% | — | — |
| 2019 | 19.4% | 15.2% | 13.6% | 7.9% | 4.0% | 3.0% | 2.1% | — | — |
| 2020 | 20.4% | 15.2% | 13.2% | 7.5% | 3.9% | 3.0% | 2.0% | — | — |
| 2021 | 20.8% | 15.2% | 13.1% | 7.8% | 3.8% | 3.0% | 2.0% | — | — |
| 2022 | 20.7% | 15.0% | 13.1% | 8.1% | 3.7% | 2.9% | 2.0% | — | — |
| 2023 | 21.2% | 14.9% | 12.8% | 8.4% | 3.6% | 2.9% | 1.9% | — | — |
| 2024 | 21.5% | 14.8% | 12.5% | 8.7% | 3.5% | 2.9% | 1.9% | — | — |
| 2025 | 21.8% | 14.7% | 12.3% | 9.0% | 3.4% | 2.9% | 1.9% | — | — |
Together, China and India accounted for 30.8% of global GDP in 2025. Their large populations and lower production costs give both countries greater weight when output is measured using purchasing power parity.
Whether this shift continues will depend partly on how China addresses demographic pressures similar to those facing Japan and the European Union, as well as broader challenges related to productivity and economic growth.
To see how the world’s major Western industrialized economies are losing GDP share, read The G7’s Share of Global GDP is Shrinking on Voronoi, the new app from Visual Capitalist.
Tyler Durden Wed, 08/05/2026 – 04:15
Source: https://freedombunker.com/2026/08/05/how-economic-power-has-shifted-over-the-past-200-years/
Anyone can join.
Anyone can contribute.
Anyone can become informed about their world.
"United We Stand" Click Here To Create Your Personal Citizen Journalist Account Today, Be Sure To Invite Your Friends.
Before It’s News® is a community of individuals who report on what’s going on around them, from all around the world. Anyone can join. Anyone can contribute. Anyone can become informed about their world. "United We Stand" Click Here To Create Your Personal Citizen Journalist Account Today, Be Sure To Invite Your Friends.
LION'S MANE PRODUCT
Try Our Lion’s Mane WHOLE MIND Nootropic Blend 60 Capsules
Mushrooms are having a moment. One fabulous fungus in particular, lion’s mane, may help improve memory, depression and anxiety symptoms. They are also an excellent source of nutrients that show promise as a therapy for dementia, and other neurodegenerative diseases. If you’re living with anxiety or depression, you may be curious about all the therapy options out there — including the natural ones.Our Lion’s Mane WHOLE MIND Nootropic Blend has been formulated to utilize the potency of Lion’s mane but also include the benefits of four other Highly Beneficial Mushrooms. Synergistically, they work together to Build your health through improving cognitive function and immunity regardless of your age. Our Nootropic not only improves your Cognitive Function and Activates your Immune System, but it benefits growth of Essential Gut Flora, further enhancing your Vitality.

Our Formula includes: Lion’s Mane Mushrooms which Increase Brain Power through nerve growth, lessen anxiety, reduce depression, and improve concentration. Its an excellent adaptogen, promotes sleep and improves immunity. Shiitake Mushrooms which Fight cancer cells and infectious disease, boost the immune system, promotes brain function, and serves as a source of B vitamins. Maitake Mushrooms which regulate blood sugar levels of diabetics, reduce hypertension and boosts the immune system. Reishi Mushrooms which Fight inflammation, liver disease, fatigue, tumor growth and cancer. They Improve skin disorders and soothes digestive problems, stomach ulcers and leaky gut syndrome. Chaga Mushrooms which have anti-aging effects, boost immune function, improve stamina and athletic performance, even act as a natural aphrodisiac, fighting diabetes and improving liver function. Try Our Lion’s Mane WHOLE MIND Nootropic Blend 60 Capsules Today. Be 100% Satisfied or Receive a Full Money Back Guarantee. Order Yours Today by Following This Link.


| Visits: | 1,830,437,373 |
| Stories: | 8,695,603 |
Whistler Blowers, Insiders

